When analyzing Electron apps, an HTTP proxy can be very helpful. Most apps, however, do not offer a nice GUI option or CLI arguments to specify a proxy. In this case, you need to force the application into the proxy. This page is mainly a dump of stuff which I came across and is not super curated. I don’t know in all cases which ones worked and which ones did not. I’ve you have more detailed feedback or knowledge on those methods, feel free to contact me and I’ll update this list.
Without Modifications #
Try those tricks first without modify the Electron application.
Environment Variables #
The application maybe respects the environment variables http_proxy and http_proxy.
# Linux
export http_proxy="http://127.0.0.1:8080"
export https_proxy="http://127.0.0.1:8080"
/path/to/app

# Windows (cmd)
set http_proxy="http://127.0.0.1:8080"
set https_proxy="http://127.0.0.1:8080"
.\path\to\app.exe

# Windows (PowerShell)
$env:http_proxy="http://127.0.0.1:8080"
$env:https_proxy="http://127.0.0.1:8080"
.\path\to\app.exe
Forcing a proxy #
mitmproxy↗ has a local mode↗. This allows for app-specific capture. And it is cross-platform!
mitmproxy --mode local:curl  # Intercept cURL only.
mitmproxy --mode local:42    # Intercept PID 42 only.
With Modifications #
Those tricks require that you unpack the asar file found in your Electron directory. For this you can use the official asar↗ application.
# unpack
asar extract app.asar OUTPUT

# pack
asar pack INDIR app.asar
Environment Variables #
You can also set environment variables inside the JavaScript that gets launched via Electron. Those should be set in the main.js file (or similar, depends on your application). Respecting those is up to the app.
process.env.HTTP_PROXY = 'http://yourproxy:port';
process.env.HTTPS_PROXY = 'http://yourproxy:port';
process.env.ELECTRON_DISABLE_SECURITY_WARNINGS = '1';
process.env.NODE_TLS_REJECT_UNAUTHORIZED = '0';
webContents.session.setProxy() #
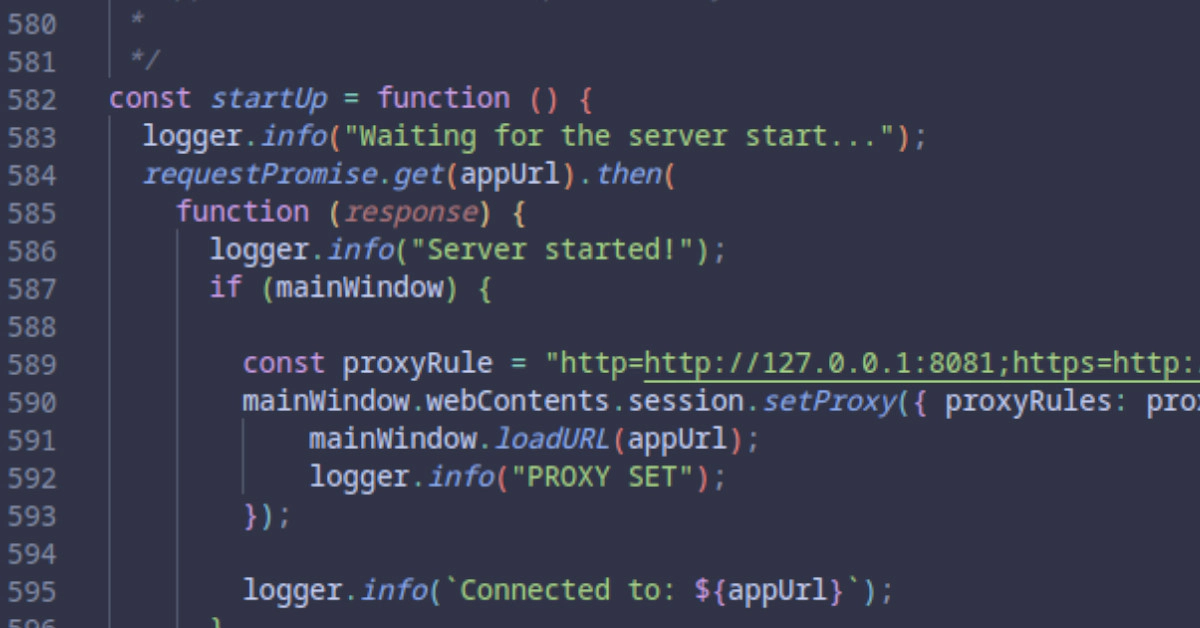
Using BrowserWindow() it’s possible to set a proxy before the main loadURL() is called. Find where loadURL is used in the code you extracted.
//BrowserWindow().loadURL(appUrl);

const proxyRule = "http=http://127.0.0.1:8081;https=http://127.0.0.1:8081";
BrowserWindow().webContents.session.setProxy({ proxyRules: proxyRule }, function () {
    BrowserWindow().loadURL(appUrl);
});
session.defaultSession.setProxy() #
Also, just after imports you can specify a proxy for the session and hook on app.on() to disable certificate checks. Find where app is defined in the code you extracted.
const proxyRule = "http=http://127.0.0.1:8081;https=http://127.0.0.1:8081";
session.defaultSession.setProxy({ proxyRules: proxyRule });

// Ignore SSL certificate errors
app.on('certificate-error', (event, webContents, url, error, certificate, callback) => {
    event.preventDefault();
    callback(true);
});
Bonus Häcks #
DevTools
Some programs show you a menu bar when pressing ALT. From there, Chrome DevTools can be enabled. Otherwise, add this to the source code. Find where BrowserWindow is defined in the code you extracted.
// Open Devtools. Requires devTools: true in webPreferences
BrowserWindow().webContents.openDevTools({ mode: 'bottom' });
// Enable the menu bar which can toggle the dev tools
BrowserWindow().setMenuBarVisibility(true);
Inspect/Debug Mode
Electron apps can be debugged using Google Chrome. For this, the app needs to be launched with --inspect or --inspect-brk. In earlier versions, those flags were called --debug and --debug-brk. Once launched, open a Google Chrome browser and visit chrome://inspect/#devices. There you should be able to connect to the debug instance over a websocket.